In this article we will be covering some more advance metrics for classification task.
Sensitivity and Specificity
When evaluating medical tests, several metrics are crucial for determining their effectiveness in correctly identifying the presence or absence of a disease. Here’s a quick rundown:
Sensitivity: This measures the proportion of people with the disease who test positive. High sensitivity is ideal for screening tests because it minimizes the chance of missing a person with the disease (low false negatives).
Specificity: This indicates the proportion of people without the disease who test negative. High specificity is preferred for confirmatory tests, as it reduces the likelihood of false positives.
Understanding AU-ROC
The Area Under the Receiver Operating Characteristic Curve (AU-ROC) is a common metric used to evaluate model performance by plotting the True Positive Rate (TPR) against the False Positive Rate (FPR) at various thresholds. The model with the highest area under the curve is generally considered the best.
For instance:
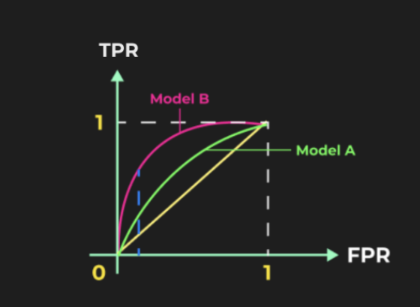
- If Model B has a greater AUC than Model A, then Model B is superior.
- However, AU-ROC is not effective for highly imbalanced data.
AU-ROC vs. Other Metrics
AU-ROC is distinct from metrics like Precision, Recall, or F1-score because it considers all possible thresholds, not just a fixed threshold like 0.5. It also does not depend on the actual values of predictions but rather on their relative ordering.
For example:
- If two models produce different predicted values but maintain the same order, their AUC will be identical.
AUC in Imbalanced Data
AU-ROC can be misleading with imbalanced datasets. In such cases, the Area Under the Precision-Recall Curve (AU-PRC) is a better alternative.
- PRC Plot: Precision is on the y-axis, and Recall is on the x-axis. The area under this curve gives us the AU-PRC, which is a reliable metric for imbalanced datasets.
G-Mean: A Solution for Imbalanced Data
When dealing with imbalanced data, the Geometric Mean (G-Mean) is useful as it considers both sensitivity and specificity, providing a balanced performance measure across all classes.
- G-Mean Formula: $$\text{G-Mean} = \sqrt{\text{Specificity} \times \text{Sensitivity}}$$
Metric Selection Cheat Sheet
- Probabilities of Classes: Use Log loss.
- Balanced Classes: Use Accuracy.
- Imbalanced Classes:
- Critical FP: Use Precision.
- Critical FN: Use Recall.
- Balance Between Precision and Recall: Use F1 Score.
- Overall Concern (TN and TP): Use AU-ROC.
- Severe Imbalance: Use PR AUC.
Loss Functions vs. Performance Metrics
Performance metrics differ from loss functions in that loss functions are typically differentiable with respect to the model’s parameters, making them suitable for optimization. In contrast, not all performance metrics need to be differentiable. Some differentiable metrics, like Mean Squared Error (MSE), can serve as both loss functions and performance metrics.